2021 Annual Report
Diversity, Inclusion & Access
Mines Core Values
We, the Colorado School of Mines community, are united by our commitment to our timeless mission of educating and inspiring students from all backgrounds and advancing knowledge and innovations, with the aspiration that our graduates, ideas, actions and innovations will have a transformative impact on individuals and society, leading to shared prosperity and sustainable use of the Earth’s resources.
From the President

Dear Colleagues,
The 2021 Diversity, Inclusion & Access (DI&A) Annual Report shows that our Oredigger community continues to make great strides in promoting diversity, enhancing inclusion and increasing access. Notably, in Fall 2021, Mines welcomed the largest and most diverse incoming first-year class in the university’s history.
As a STEM institution, Mines emphasizes data-driven and evidence-based approaches to track our progress and make course corrections. This report is the second of its kind published in the past two years. It reiterates our university-wide aspirations, and reviews the efforts, initiatives, and progress within the 24 DI&A Strategic Plan recommendations. I encourage you to take the time to read the report, review the data, and acknowledge the hard work that Orediggers are doing across campus.
There is still much work to do, but I believe that our community’s strong commitment and collaborative efforts will lead to continued progress toward our aspirational goals. In the meantime, thank-you for your contributions and efforts. Let’s remember to celebrate the successes we’ve achieved and stay focused on our MINES@150 DI&A goals. They are critical to Mines’ future and we all have a role to play in achieving them.
Go Orediggers!
Paul C. Johnson, President and Professor
Colorado School of Mines
DI&A is a central component of the MINES@150 strategic plan. To be a first-choice and top-of-mind institution, MINES@150 focuses on seven high-level goals, all of which can only be achieved with the support of diversity, inclusion and access
 Per the MINES@150 playbook, in 2024, Mines will be:
- Accessible and attractive to qualified students from all backgrounds.
- A great community in which to learn, explore, live and work.
- A leader in educating STEM students and professionals.
- A preferred partner for talent, solutions and lifelong learning.
- A producer of differentiated and highly desired STEM-educated leaders.
- A go-to place for use-inspired research and innovation needed for industry and societal changes.
- The exemplar for alumni affinity, visibility and involvement.
Annual Report Overview
Colorado School of Mines is committed to cultivating a campus environment for community members that has diverse representation, is inclusive for all individuals and groups and promotes full accessibility, both in access to higher education and in Mines’ resources and facilities. A diverse and inclusive institution works to inspire innovation and creativity among its members, which is integral to science and engineering. Published in February 2019, the Strategic Plan for Diversity, Inclusion & Access (DI&A) outlined four goals:
Goal 1
Attract, retain and graduate a thriving and diverse student body.
Goal 2
Attract, retain, develop and promote a thriving and diverse employee community.
Goal 3
Cultivate a campus culture that promotes and celebrates inclusion and achievement.
Goal 4
Inspire a shared responsibility, participation and accountability for DI&A efforts across the entire Mines community.
To achieve these goals, the Strategic Plan presents 24 specific, measurable, achievable, realistic and timely (SMART) recommendations rooted in evidence-based best practices for DI&A in higher education. Accomplishing these goals is particularly salient as Mines prepares for its 150th anniversary in 2024. Mines DI&A is a vital component to the MINES@150 strategic plan. The recommendations provide opportunities for Mines to be a leader in educating science, technology, engineering and mathematics (STEM) students through signature experiences designed to support students from all backgrounds and academic disciplines.
While there is still much to do, this report contains ample evidence that the Mines community is gaining traction on this important work.
2021 Mines Demographics
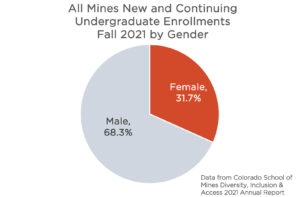
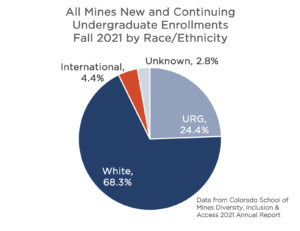
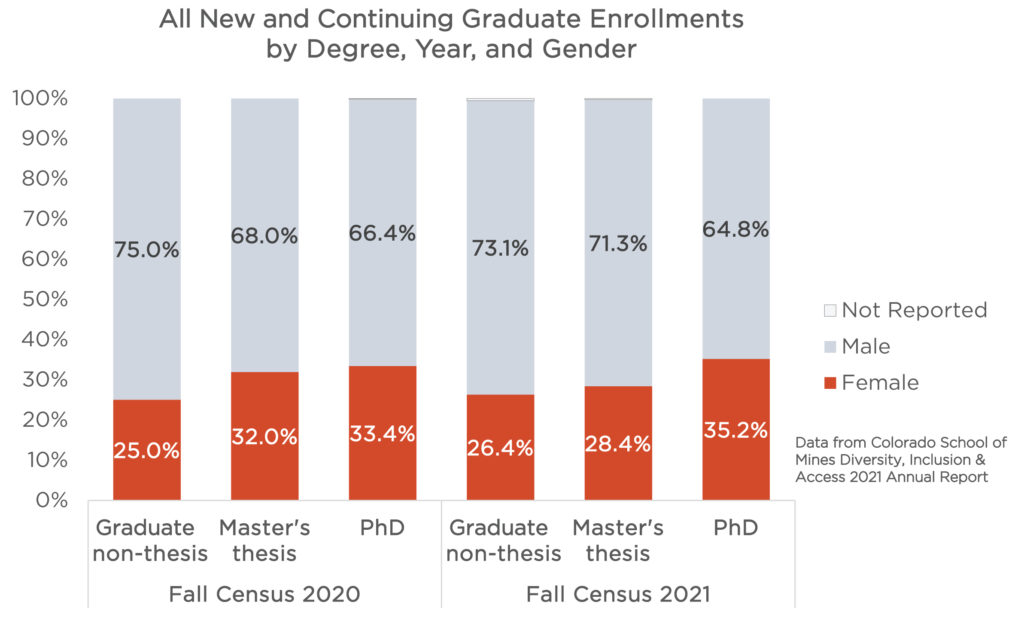
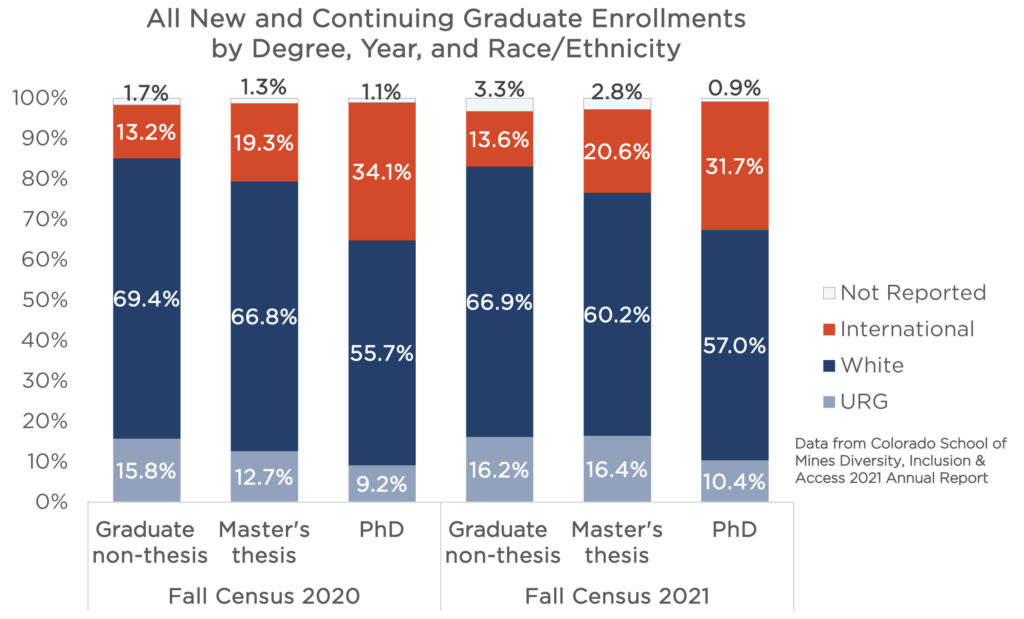
This report has a plethora of data to show how Mines is progressing toward the Mines DI&A Strategic Plan goals. To provide context, the following data present the overall demographic breakdowns of Mines’ community members: undergraduate and graduate degree-seeking students and employees – both academic faculty and staff. These data will set the stage for understanding trends at Mines over time, as found in subsequent sections of this report.
Please note: In the previous and current DI&A Annual Reports, Gender is defined as only either male or female due to limitations in data collection and reporting. Mines is currently working on developing new processes for collecting inclusive and accurate gender identity information. We acknowledge this definition of gender is limiting; work towards inclusive identity data collection is ongoing.
Undergraduate Students
Graduate Students
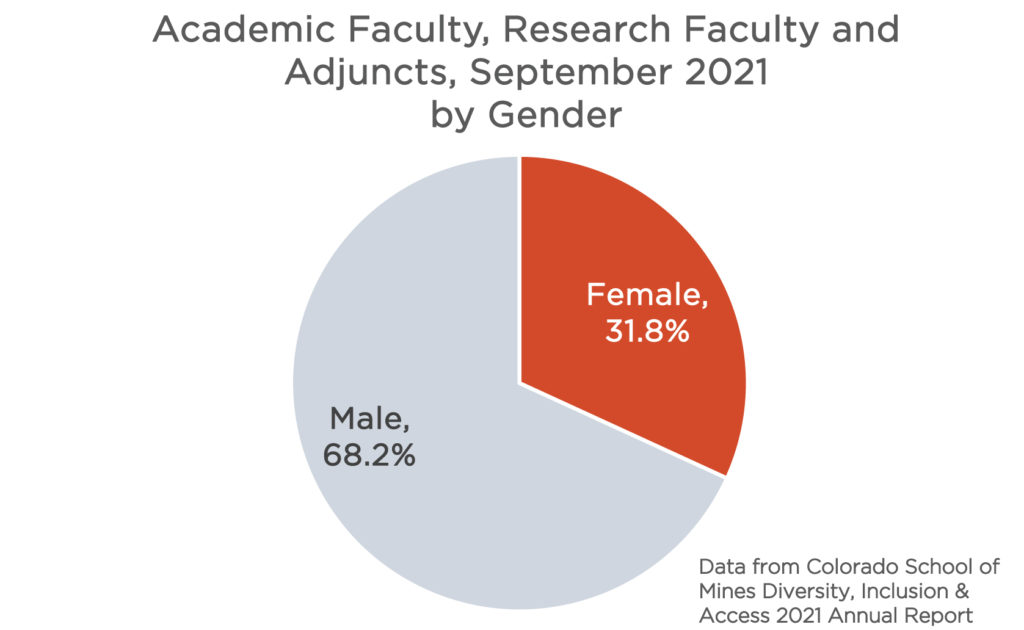
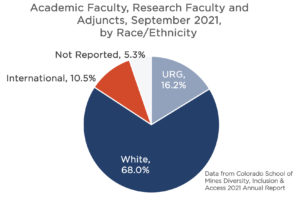
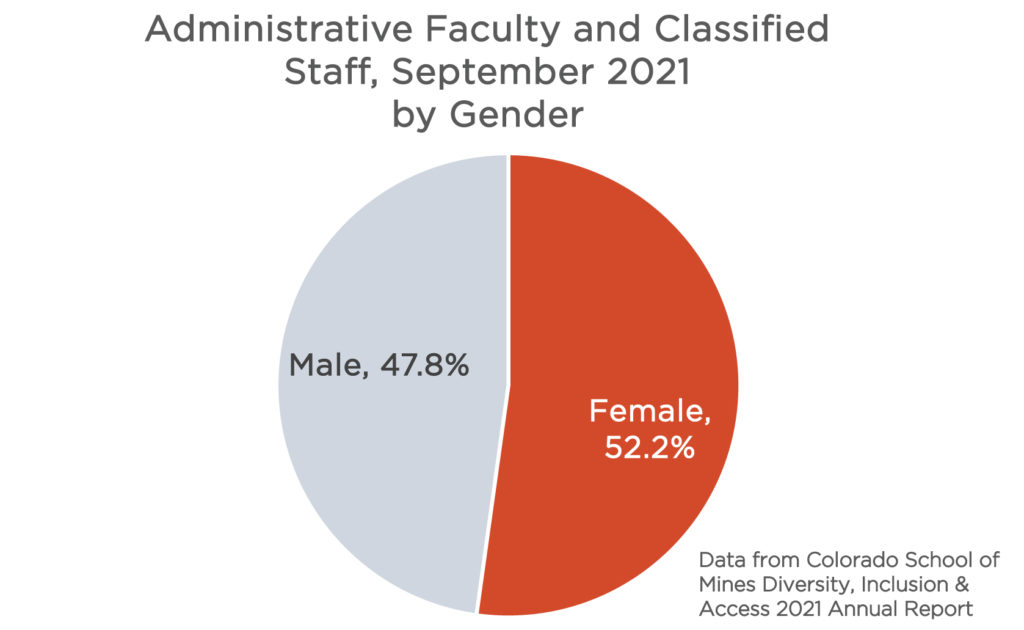
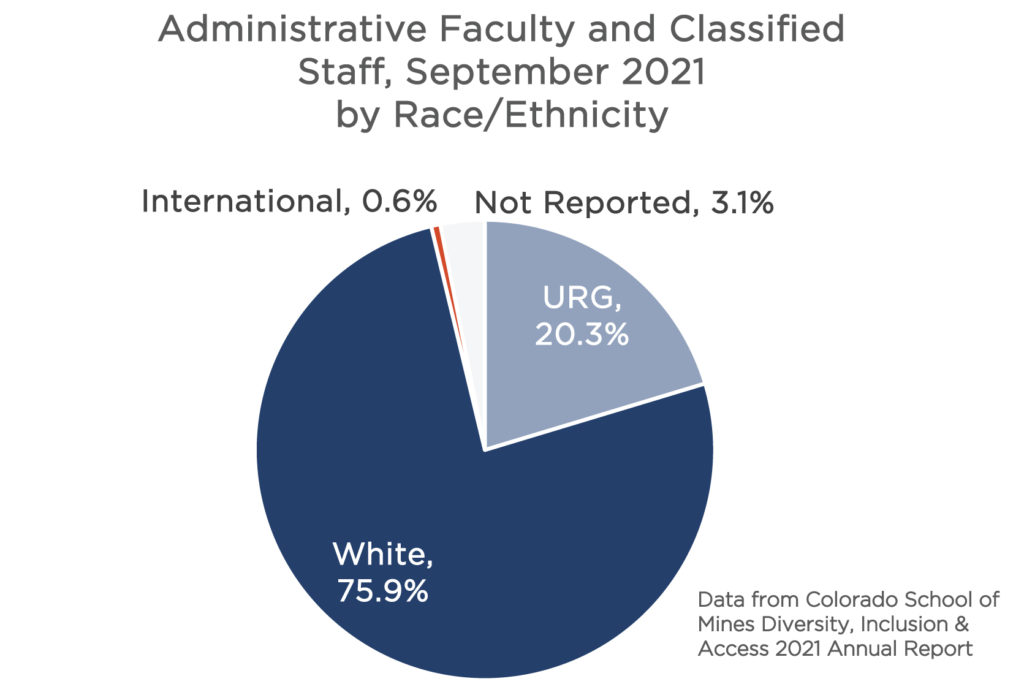
Employees
Priority Focus Areas and Strategic Initiatives
Recruitment

- Hiring Excellence minimizes bias in talent acquisition
- Vanguard Scholars Program enhances recruitment of women undergraduate students
- Admissions and Mines Foundation diversify their selection committees to broaden representation
- Admissions counselors integrate strategies to reduce implicit bias in review of applications
Retention

- Hiring Excellence minimizes bias in talent acquisition
- Vanguard Scholars Program enhances recruitment of women undergraduate students
- Admissions and Mines Foundation diversify their selection committees to broaden representation
Culture of Inclusion

- Inclusive classroom checklist and workshops foster inclusion in the classroom
- Implicit bias and microaggressions workshops build active bystander intervention skills throughout the Mines community
- Campus climate surveys such as ModernThink, oSTEM, Trefny’s Student Survey and Viewfinder provide insights into students’ and employees experiences
- Multiple efforts to increase DI&A-related knowledge and topics in the classroom, such as CSM 101 lesson plans, curriculum on facilitating difficult conversations and service-learning courses, help foster inclusion
- Mines expanded access to technology for students in need through the “Raise your Hand” program
Shared Responsibility

- Implementation plans and reports enable units to address their specific DI&A needs
- DI&A in performance evaluations encourage employee engagement and continued learning
- Advocates and Allies and Ambassador programs build DI&A expertise across campus
- Mines DI&A supports Fellows to lead new and innovative projects that have large-scale impacts on the campus community
Data & Metrics

- DI&A Unit Reports increase transparency and enable tracking of progress made on unit implementation plans
- DI&A Annual Report provides data and metrics to inform efforts
- The Institutional Research and Strategic Analytics team provides data in real-time through Tableau visualization dashboards
Foster Dialogue

- Annual “Celebration of DI&A” event provides progress updates and learning and development opportunities to campus
- DI&A learning and development events held across campus create safe spaces to discuss difficult topics
- #OrediggersForEquity campaign encourages self-directed learning and dialogue
- DI&A Council meets monthly to foster dialogue
- MCAs host learning and development events to deepen DI&A knowledge and skills
Rewards and Recognition

- DI&A-related Awards recognize contributions Orediggers made across campus, such as the Mines DI&A Awards, MLK Awards and MEP Awards.
- The Mines DI&A Community Grants program funded $5,000 for new activities to bolster DI&A on campus
- Over $20 million in external funding awarded that have key DI&A elements in the projects
